
An Irregular Time Series contains sparse numerical data, which makes it easy to edit. The main example of a metadata sequence of this type is the modifiers.
Display
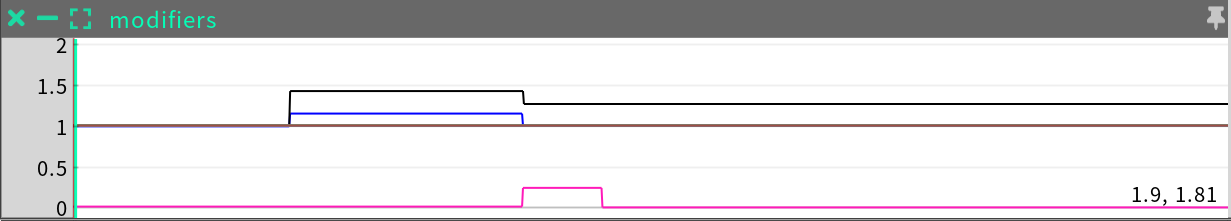
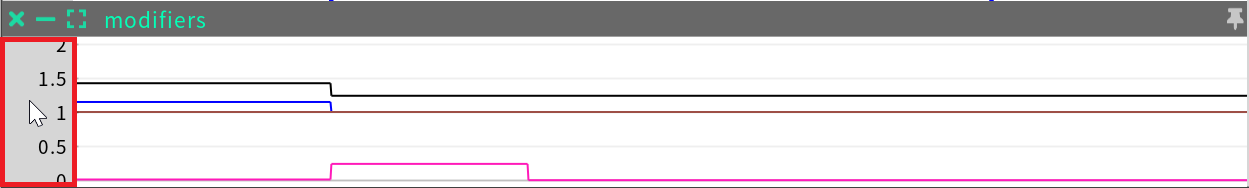
An Irregular Time Series is displayed as a plot of each of its channels:
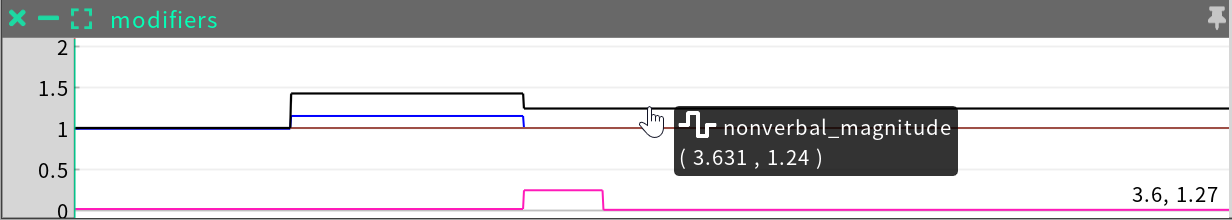
Hovering over a channel displays its name and value at that time point:
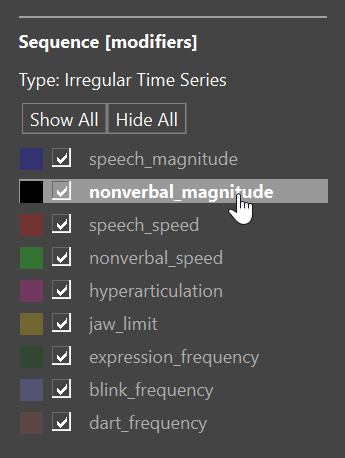
When an Irregular Time Series is selected, the Sequence properties section in the Inspector will show this layout:
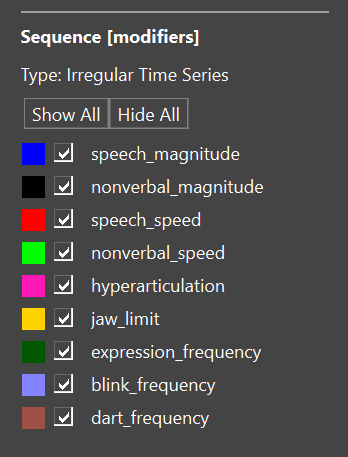
which includes a list of channels. For each channel, the list shows:
-
the plot color of the channel
-
a checkbox for visibility of the channel
-
the name of the channel
Tick the checkbox in a particular row to hide/show that channel in the display. Press the Show All button to show all channels, and press Hide All to hide all channels.
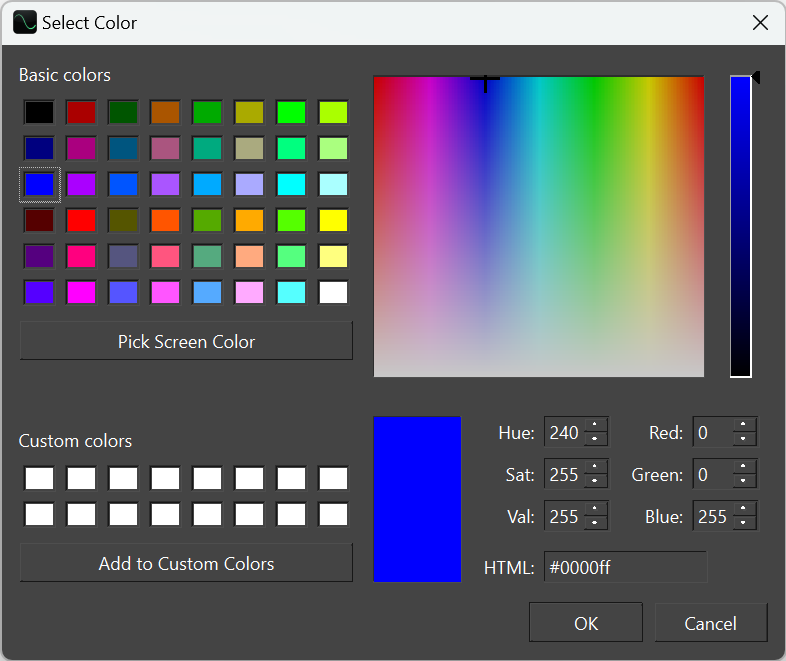
If for some reason you wish to change the plot color of a channel, click on the color square to bring up a color picker:
Range controls
An Irregular Time Series can have its Y-range zoomed and panned.
To zoom the Y-range, hover over the axis area, and use Shift+Ctrl+wheel scroll.
To pan the Y-range of the sequence, engage panning control (click the middle mouse button or Shift+Ctrl+left mouse button) anywhere inside the sequence, and drag vertically. (Horizontal panning will shift the visible timeframe of the entire event.)
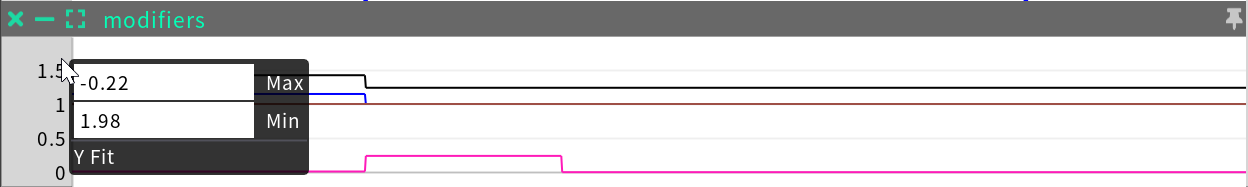
A more precise way to set the Y-range is through the axis settings, which you can bring up by right-clicking on the axis. Enter the minimum and maximum values explicitly, or click on Y Fit to fit the range to the spread of data in the sequence.
Channel selection
Channel selection is useful for editing channel data in an Irregular Time Series. There are two ways to select a channel:
-
Click on the plot line in the view.
-
Click on the name of the channel in the Inspector.
When a channel is selected, the other channels appear grayed out, both in the Inspector and in the plot:
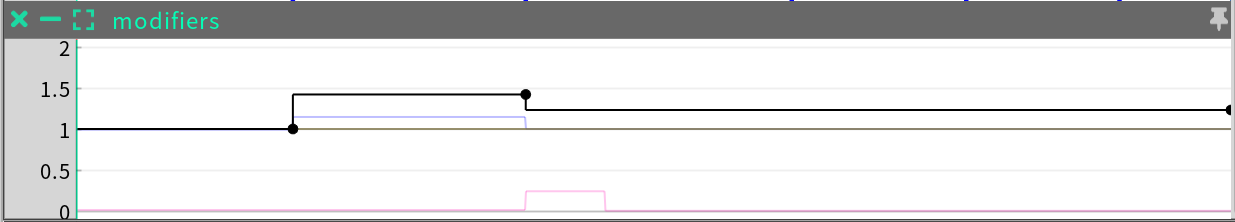
When a channel is selected in an Irregular Time Series, the data points are shown, and you can also hover on them to see their values:
To unselect a channel, either click on its name again in the inspector, or hit esc on the keyboard while the sequence is selected.
Editing y-value
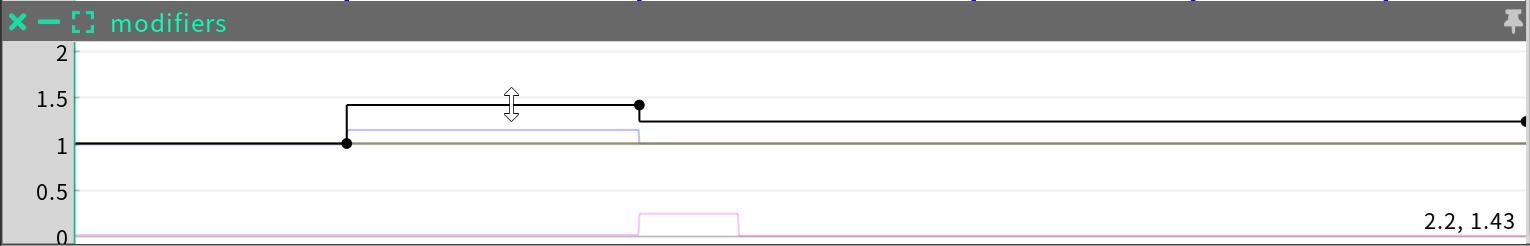
To edit the y-value over an interval:
-
Select the channel to be edited.
-
Hover over the interval you want to move; the cursor will change to a double-arrow.
-
Click and drag the line up or down.
An example is shown below.
Editing x-value (duration)
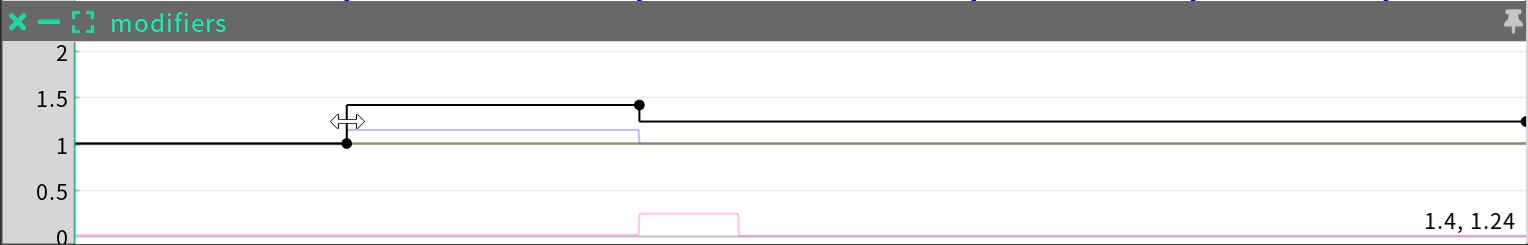
To stretch or contract an interval in the x dimension (time):
-
Select the channel to be edited.
-
Hover over the vertical transition line at the beginning or end of the interval; the cursor will change to a double-arrow.
-
Click and drag the line left or right.
An example is shown below.
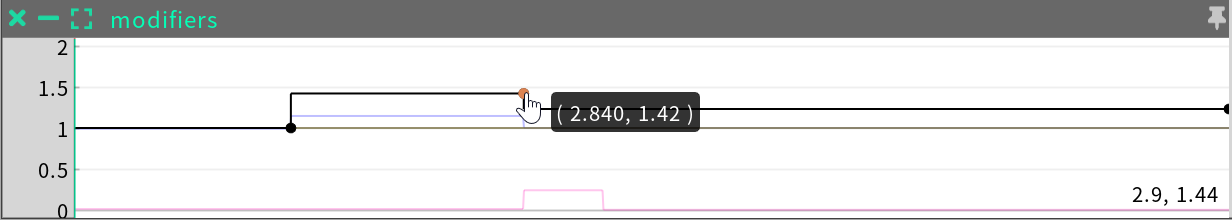
Editing x and y together
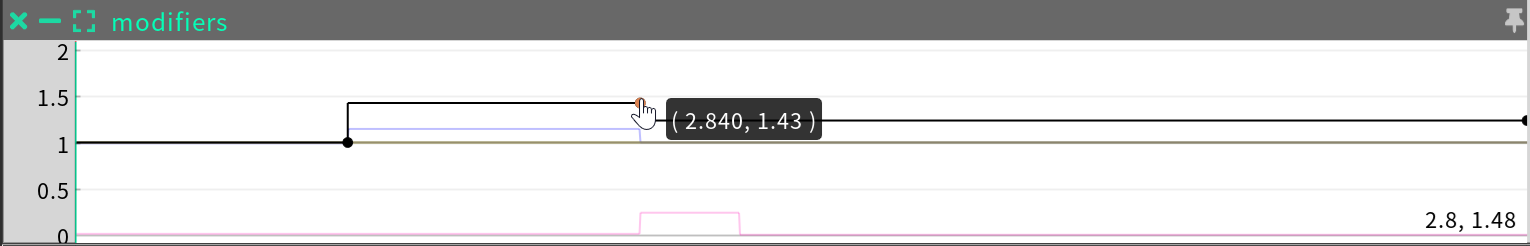
To edit both x and y at the same time:
-
Select the channel to be edited.
-
Hover over the data point you want to move; the cursor will change to a pointing hand.
-
Click and drag the point up, down, left or right.
An example is shown below.
Inserting an interval
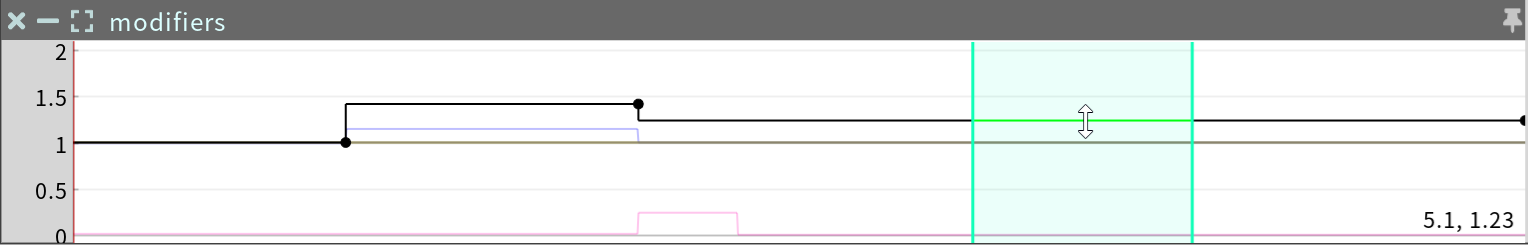
To insert a new interval:
-
Select the channel to be edited.
-
Select the time interval (see Time selection). The corresponding segment of the target channel will turn green.
-
Hover over the green line segment.
-
Click and drag the line up or down.
An example is shown below.
Inserting a point
To insert a new data point:
-
Select the channel to be edited.
-
Double click anywhere in the sequence. A new data point will appear at that position.
An example is shown below.
Deleting a point
To delete a data point:
-
Select the channel to be edited.
-
Select the point to be deleted.
-
Press the delete key on your keyboard.
Due to the constant interpolation method, after deleting a data point from the Irregular Time Series, the interval terminated by that point takes on the value of the following point.
An example is shown below.